
Healthy cities — walkability as a component of health-promoting urban planning and design. © 2016 Minh-Chau Tran. This is an Open Access article
distributed under the terms of the Creative Commons Attribution-NonCommercial 4.0 International License (http://creativecommons.org/licenses/by-nc/4.0/),
permitting all non-commercial use, distribution, and reproduction in any medium, provided the original work is properly cited.
11
RESEARCH ARTICLE
Healthy cities — walkability as a component of
health-promoting urban planning and design
Minh-Chau Tran
Institute of City Planning and Urban Design, University of Duisburg-Essen, 45141 Essen, Germany
Abstract: Health impairments due to inactivity are related to the car-oriented urban development of recent decades, along
with sedentary lifestyles. A health-maintaining environment must therefore not only reduce direct health risk factors
(pathogenic concept), but also contribute to health chances that may indirectly support health (salutogenic concept).
Walking has been identified as the most influenceable behavior; it is also the most environmental-friendly mode of
transport, social and health. From the planning view, the concept of walkability therefore aims at a built environment
facilitating physical activity. It is increasingly recognized that walkability has become an important topic in the field of
planning, urban design and health, since the built environment affects certain behaviors. From practice, concrete guidance
is demanded as to the type of urban design features to be captured or applied to evaluate the walkability or to create active
cities. The measurement of features of the built environment plays a special role in this context, but also the question of
how research results can reach policies as well as planning and building practice.
Keywords: health-promotion, urban design, urban planning, built environment, walkability, physical activity
Correspondence to: Minh-Chau Tran, Institute of City Planning and Urban Design, University of Duisburg-Essen, 45141 Essen, Germany;
Email: minh[email protected]
Received: February 13, 2016; Accepted: April 15, 2016; Published Online: June 2, 2016
Citation: Tran M-C, 2016, Healthy cities — walkability as a component of health-promoting urban planning and design. Journal of
Sustainable Urbanization, Planning and Progress, vol.1(1): 11–21. http://dx.doi.org/10.18063/JSUPP.2016.01.006.
1. Introduction — Reconnecting Urban Plan-
ning and Public Health
he rapid increase of people living in cities
will be among the most important global health
issues of the 21st century
[1]
. Though in devel-
oped countries, as well as in many developing coun-
tries, the standard of living and economic prosperity
are increasing compared to the past, it is not always
and necessarily going hand in hand with the “quality
of life” and health of the population. Improved urban
supply and disposal systems, as well as living condi-
tions, have led to health enhancement of the urban
population. This — in combination with the progress
in different sectors such as health care, hygiene, nutri-
tion and working conditions — resulted in an increase
of life expectation. This surely might be a merit of the
traditionally close collaboration between the profes-
sions of urban planning and public health with the
common goal of reducing harmful impacts of indu-
strialization and urbanization.
According to the planning ideology of the car
oriented city in the 1960s, urban spaces have since
then been created with negative impact on health. At
the same time the close connection between both pro-
fessions broke off. Public health concentrated on indi-
vidual biomedical factors. Urban planning lost sight of
its original mission of tackling the health problems of
the least well-off and merely focused on spatial and
functional structures
[2]
. Health experts have now iden-
tified new primary health risks and adverse health ef-
fects that are closely connected to car-oriented urban
development in recent decades
[3]
. Yet, still many parts
of the world currently follow the traditional car friend-
T
Healthy cities — walkability as a component of health-promoting urban planning and design
12 Journal of Sustainable Urbanization, Planning and Progress (2016)–Volume 1, Issue 1
ly city model with separation of functions and sprawl,
ignoring human scale and resulting in oversized roads
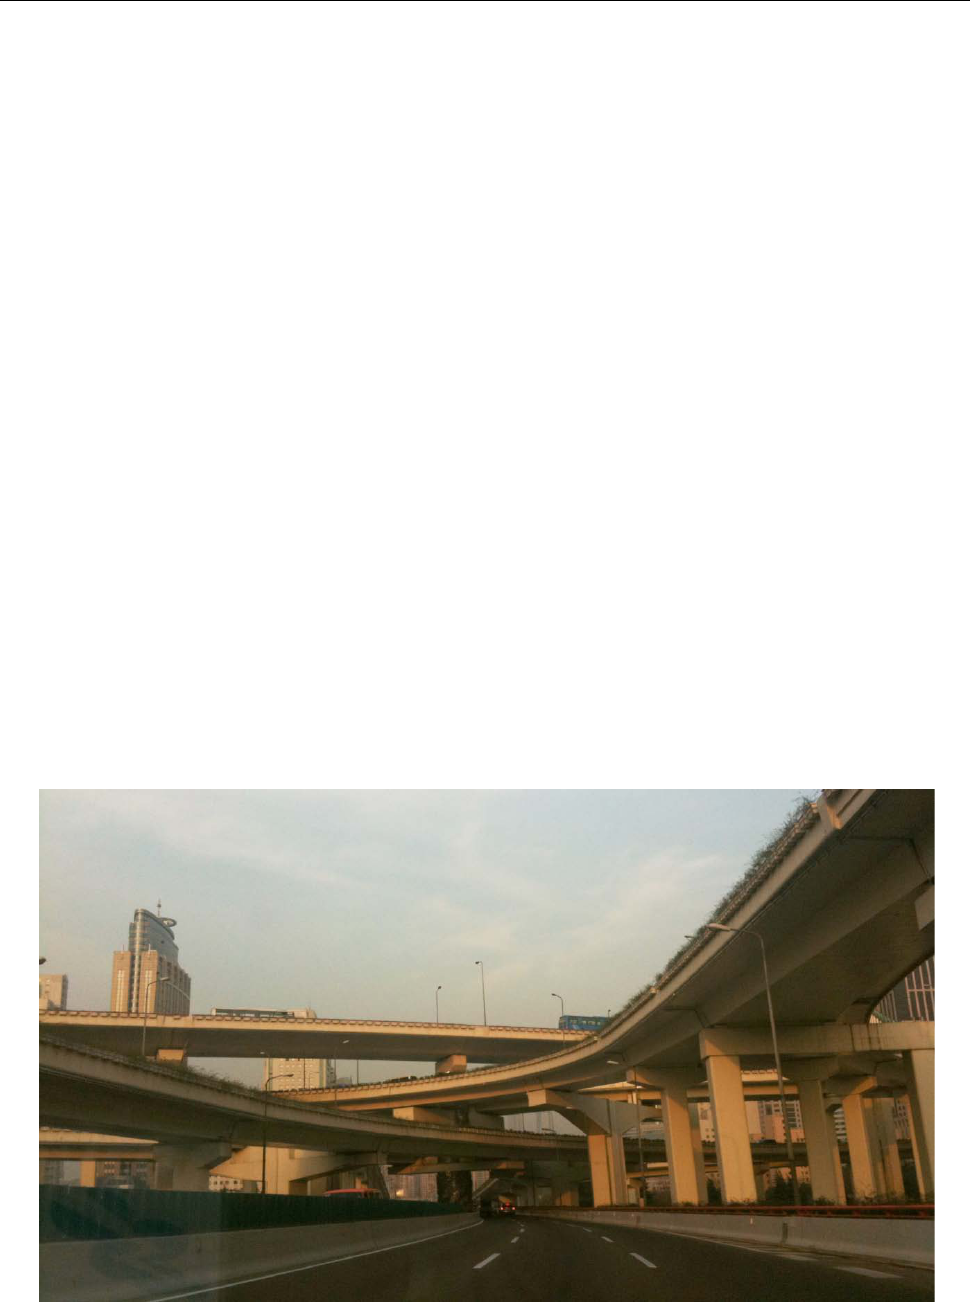
for motorized individual traffic. Since in many coun-
tries development and modernity are still associated
with technology, external financing favors large con-
struction projects such as urban highways, elevated
pedestrian pathways or skyways
[4]
(Figure 1).
This has resulted in unhealthy living environments
due to congestion, noise emissions, street fatalities,
increase of CO
2
and global greenhouse gases, and at
the same time support unsustainable, inactive life-
styles and inequity in street use. In cities of northern
China, levels of the most dangerous particulates reach
almost 50 times of the maximum limits stipulated by
the World Health Organization
[5]
. As a result, there
has been a shift from primarily infectious diseases to
more non-communicable chronic diseases such as
cardiovascular disease, diabetes or neurological dis-
orders
[6]
. There is also a lack of social interactions in
cities that evidently increases mortality risk signifi-
cantly
[7]
. Moreover, a continuous increase of obesity
around the world within the last decades is associated
with the built environment
[8,9]
. This is not only ob-
served in Western countries but also in China, Viet-
nam or India
[10]
. “Yet health policies in most rapidly
urbanizing countries remain dominated by dis-
ease-focused solutions that ignore the social and
physical environment. As a result, health problems
persist, and health inequities have increased”
[1]
. From
an individual point of view, health development leads
apart from reduced life span to reduced quality of life.
From a social point of view, it is the high finan-
cial burden of the health care system, which leads to
growing research in this field.
Because negative health developments still proceed
in many developing countries which run parallel to
urbanization processes, even though with a time lag
compared to developed countries, the challenges, ef-
fects and health outcomes worldwide are expected
to be comparable in spite of differences in spatial
scale and size. However, the strategies and policies to
tackle these health issues are different due to culture
and mentality.
The causes for health and illnesses cannot be ex-
plained on an individual level anymore. Rather, it is
found that health occurs as an interaction between
individual, social and built environment. Individual
measures alone are not sufficient to allow urban pop-
ulation to lead a healthy lifestyle. Rather, fundamental
environmental changes are necessary in order to per-
manently establish healthy behavior for all
[11]
. A
health-maintaining environment must therefore not
only reduce direct health risk factors such as noise and
particular matter (pathogenic concept), but also con-
tribute to health chances that may indirectly promote
healthy behavior (salutogenic concept) on which the
Figure 1. Car-oriented urban development in Shanghai (Source: Alexander Schmidt)

Minh-Chau Tran
Journal of Sustainable Urbanization, Planning and Progress (2016)–Volume 1, Issue 1 13
focus of this article is explained here. The health pro-
moting city not only stays an issue for the health sec-
tor but is also part of the mission statement of a sus-
tainable urban development.
This article primarily deals with the concept of
walkability and outlines an overview of the walkabil-
ity research. Based on current studies, it is exempli-
fied by the type of features of the built environment,
the level of walkability that can be identified, the
challenges of creating activity-friendly cities and
neighborhoods, and approach of the research results
that are able to satisfy the policy as well as planning
and urban design practices.
2. Conceptual Issues – Health-Related Factors
in Urban Planning
A comprehensive understanding of urban structure,
design of spaces and city planning processes as critical
determinants of population health is crucial
[12]
. On
World Health Day 2010, the World Health Organiza-
tion recommended the following five calls to action
to build a healthy and safe urban environment: (i)
promote urban planning for healthy behaviors and
safety, (ii) improve urban living conditions, (iii) en-
sure participatory urban governance, (iv) build inclu-
sive cities that are accessible and age-friendly, and (v)
make urban areas resilient to emergencies and disas-
ters
[13]
. To address the lack of a conceptual framework
for integrating health into spatial planning decisions,
Barton
[14]
developed a conceptual model of settle-
ments that places human health and well-being at its
heart (Figure 2). The model combines an ecosystem
analysis expressing the relationship between people
and their environment with a public health approach,
which identifies the relevant social and environmental
determinants of health. This does not include heredity
factors since the focus of this health map is on the
social and environmental determinants of health
[14]
.
Regarding the effects of the built environment on
health, numerous evidence-based findings exist
[16,17]
.
For example, individual behavior and lifestyle are af-
fected by the presence, safety and quality of routes
and uses, by the density and structure of cities, and by
the distances to certain destinations. Broader envi-
ronmental conditions, including air, water, soil and
climate, are affected by planning policy and can
even be critical to health in some contexts
[18]
. A study
lead by WHO identified twelve health objectives for
planning, related to equity, exercise, social cohesion,
housing, work, accessibility, food, safety, air quality,
Figure 2. Health map. Own illustration based on Barton
[14]
developed from the model by Dahlgren and Whitehead
[15]
.
water, earth and climate
[19]
. This provides an agenda
for analyzing health impacts. A holistic approach for
health promoting urban planning should ideally con-
sider all of these factors and at the same time integrate
their interrelations.
Since this article represents the urban design pers-
pective, further focus lies on the sphere of the built
environment
[20]
. The built environment of a city in-
corporates not only buildings, streets, squares, and
green spaces as well as urban planning features like
land use, density, infrastructures and transportation
systems, but also urban structures and urban form.
3. From Car-oriented to Health-promoting Ac-
tive Cities and Neighborhoods
It has been proved that health derives from the inte-
raction between the individual and its social and built
environment
[19,21]
. Car-oriented urban spaces increa-
singly impede daily physical activity, coincidently
with our modern inactive lifestyles. The lack of green
open spaces, for sojourn and physical activity and safe
traffic areas for environmental-friendly local mobility
negatively affects the health and quality of life of city
dwellers. This results from a minimum of daily wa-
lks
[22]
. In many countries 80% of adults do not achieve
the recommended level of activity of 150 minutes of
exercise a week
[23]
. Correlations between the lack of
exercise and a high risk, for example, of developing
cardiovascular disease and cancer, are well known
[24]
.
Lack of physical activity is the developed world's
fourth largest risk of death after smoking, high blood

Healthy cities — walkability as a component of health-promoting urban planning and design
14 Journal of Sustainable Urbanization, Planning and Progress (2016)–Volume 1, Issue 1
pressure and overweight/obesity
[25]
.
Walking has been identified as the movement be-
havior that can be influenced most easily and is also
the most common and simplest form of physical activ-
ity. It is increasingly recognized that the pedestrian is
not only an important object of traffic planning and
that walking is more than just another form of mobili-
ty; it is also a human behavior and thus has interna-
tionally become an important topic in the field of ur-
ban planning, urban design, mobility and health, since
the built environment affects behavior
[26]
. Recently,
more and more interdisciplinary research is dealing
with interrelations among activity-friendly urban
spaces and long-term benefits for society
[21]
. At the
same time, the readiness to develop new forms of mo-
bility and the reclaiming of urban spaces for pede-
strians and cyclists seem to give additional impetus to
this trend (Figure 3).
3.1 Walkability — More than Just Walking Friendly
The concept of walkability pursues a holistic approach
and aims at an environment encouraging active living
taking into account different spatial levels (macro and
micro levels). Generally, walkability describes the
level of pedestrian-friendly urban structures and spac-
es motivated and promoted active mobility
[27,28]
. De-
sign recommendations is not limited to using individ-
ual measures such as the improvement of traffic lights
or speed limits, because it is not only about security
for pedestrian traffic, but at the same time about the
creation of urbanity, identification and quality of life
through activity-friendly public urban spaces.
People who live in a pedestrian-friendly designed
environment participate much more in social life and
have greater confidence in their environment. That
proved a significant gain in “social capital” and thus
a better quality of life
[29]
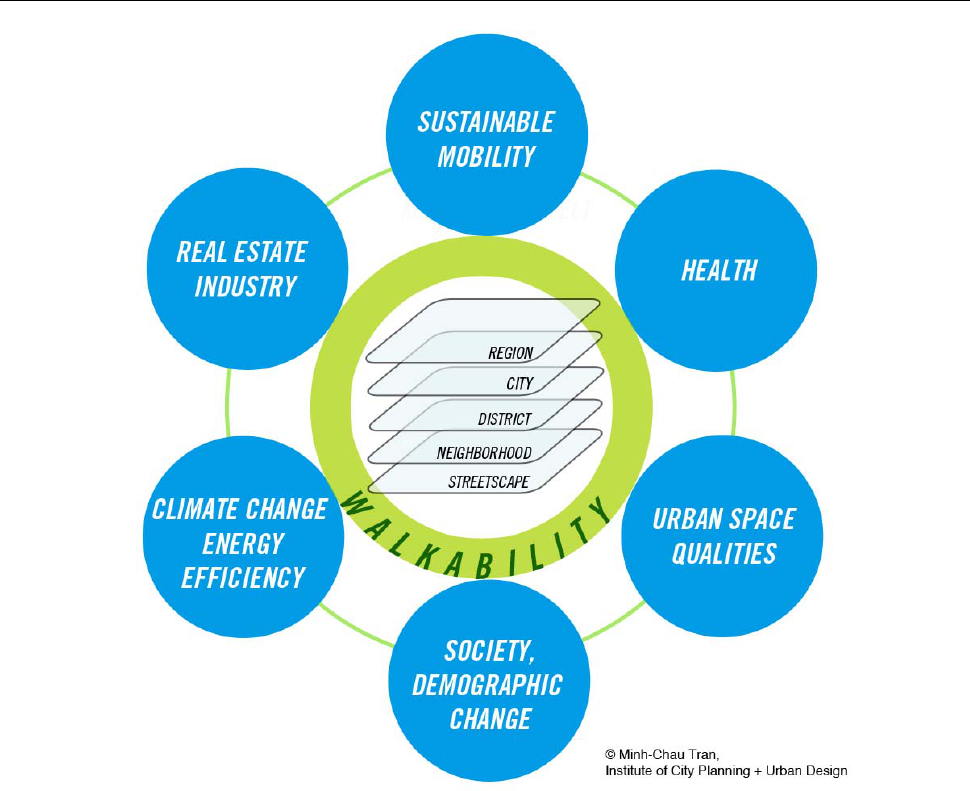
. To date, we speak of walka-
bility and its different dimensions
[30]
(Figure 4). Aga-
inst this backdrop walkability is understood as a com-
prehensive approach for a livable sustainable city and
does not only mean walk-friendliness.
3.2 Walkability Research — A Multidisciplinary Field
Walkability as a research field was first initiated in
public health from concerns about the constantly ris-
ing obesity rates worldwide. Since the 1990's multi-
disciplinary walkability research has accumulated,
namely of the Health Sciences as well as the traffic
planning and later also of urban planning, especially
in English-speaking countries
[9,31]
. The idea of walk-
ing to be facilitated by good planning and urban de-
sign is also not new in many countries, e.g. in Ger-
many
[32–34]
. Although overall awareness of the impor-
tance of health in the last three decades has grown in
the field of urban planning, walking basically seemed
to play a minor role as a mode of transport in planning.
Because today in developing countries there is suppo-
sedly no direct acute health hazard emanating from
the built environment compared to the industrialization
phase, “urban planning can apparently (...) only broach
health problems as design problems (...) where health
is objectified, measurable and generalizable”
[35]
.
Walkability research in the fields of traffic planning
and health science is therefore focusing strongly on
the measurable extent or likelihood of walking in rela-
tion to different environmental characteristics based
on analysis models
[36,37]
. Measuring walking behavior
serves to inform policy and planning and to evaluate
its impact
[38]
. An increased interest in research on an
international level was very promising, reinforced by
Figure 3. Car-oriented street space versus people-oriented street space. (Source: Institute of City Planning and Urban Design)
Minh-Chau Tran
Journal of Sustainable Urbanization, Planning and Progress (2016)–Volume 1, Issue 1 15
Figure 4. The dimensions of walkability. (Source: Institute of City Planning and Urban Design)
new evaluation methods and technologies
[38]
. This re-
search showed, for example, interrelations between
population density, connectivity, mixed use and walk
frequency
[9]
.
These results underpin empirical studies in objec-
tively measurable ways. However, they fall short as
urban walking areas are too complex for quantifica-
tions. Walking does not comprise only purpose-ori-
ented utilitarian walking, but allowed the utmost spon-
taneity and communication of all types of mobility.
Therefore, in the field of urban design there are
studies that examine the measurable and qualitative
characteristics on site
[39]
. Here, subjective qualities such
as human scale, transparency and linking street spaces
are measured with the objective to establish opera-
tional definitions for measuring urban design qualities
of these spaces. These qualities are closely linked
to basic urban principles that were formulated in var-
ious senior key publications in the fields of architec-
ture and urban design, and are still valid to this
day
[25,40–42]
. By observational studies they deal pri-
marily with the influences of urban space on behavior
patterns and social activities in order to better under-
stand the use of public spaces.
Finally, the consideration of objectively measured
environmental characteristics and the subjective per-
ception of the environment are essential for a more
comprehensive understanding of walkability.
3.3 Balance Matters — Urban Design Characteris-
tics to Evaluate Walkability and for the Planning of
Walkable Neighborhoods
Despite the increase in evidence-based knowledge and
the desire to actively intervene with the help of study
results for a change in urban planning policies and
practices, there seem to be a lack of clarity about the
urban features needed in the weighting to promote
active behaviors. Urban planners and policymakers

Healthy cities — walkability as a component of health-promoting urban planning and design
16 Journal of Sustainable Urbanization, Planning and Progress (2016)–Volume 1, Issue 1
call for clear instructions from research regarding
principal urban design features that promote health
and healthy behavior, such as walking
[43]
. In addition,
it was often unclear about the appropriate methods
that should be selected or are present to capture these
characteristics best. There are a number of different
methods to measure the characteristics of the built
environment. This can be divided into three categories:
(i) interviews or questionnaires that capture primarily
perceptions, (ii) methods that collect (existing) data,
often by using geographic information system (GIS)
analysis, and (iii) systematic observations or audit
tools
[37,44]
.
The Five “D”s
Empirically proven criteria for walkability are the five
“D”s: Density, Diversity, Design, Destination accessi-
bility, Distance to transit
[39,45]
(Table 1).
The five “D”s have the greatest impact when they
act together. It therefore requires a balance of residen-
tial use, jobs, services and facilities in the vicinity of
public transport stops and within walking radii and a
fitting of all these elements in a fine-grained urban
environment and in a cityscape that improves walking
experience on street scale
[39,45]
. In relation to large-
scale, car-oriented urban structures in the United States
or Australia the density and diversity of European
towns and cities have considerable potential to pro-
mote small-scale mobility in everyday life. Their
structures and designs can serve as best examples.
4. Case Study on Neighborhood Scale Linking
Built Environments with Health Effects
The current case study presented exemplifies a me-
thod applied on neighborhood scale about the connec-
tion of built environment features and health effects
that could be assessed and evaluated.
This recent study by Sallis and colleagues
[46]
aimed
at proving the evidence about the connection of built
environments and moderate to intense physical activi-
ty by studying different built environments across 14
cities in ten middle-income and high-income countries.
It was the largest study so far. Through linking objec-
tively measured physical activity with objectively
measured built environment features, it was observed
that urban environmental factors account for large
differences in the physical activity levels of adults.
The analyses were based on the International Phys-
ical Activity and Environment Network (IPEN) adult
study and included 6822 adults aged 18–66 years.
Neighborhoods divided into four different stratifica-
tion groups were identified in order to maximize vari-
ation in neighborhood walkability and socioeconomic
status (SES): (i) Higher walkability and higher SES,
(ii) higher walkability and lower SES, (iii) lower wal-
kability and higher SES, and (iv) lower walkability
Table 1. Overview of the five “D”s, the associated indicators and possible methods of measurement. (Source: Compiled on the basis
of Ewing/Cervero (2010)
[39]
, Campoli (2012)
[45]
)
Criterion Indicator Method
Density
Degree of density, e.g., population, housing units or jobs per hectare or km
2
As a measure, which is applicable to many of the characteristics of the built environment, density describes the
intensity of a specific element or an activity.
e.g., GIS analysis
Diversity
Level of diversity in land use and thus of people and places (Land use mix)
Diversity, or the mix of uses, creates a dense texture of destinations. A good mix of uses as to how residents can
find more everyday products and services in their neighborhoods, and do not need to travel by car. The degree
of diversity, or how many uses co-exist in one location and how close they are to each other, is crucial.
e.g., GIS analysis
Design
Presence and design of streets, walking and cycling paths as well as interconnecting streets
To lower vehicle miles traveled (VMT) two strategies are important here: The network of streets (connectivity)
in order to shorten travel distances, and creating pedestrian- and cycle-friendly roads to improve the quality of
the journey. Intersection density has been identified as one of the most important indicator of the built
environment for reducing VMT. Among the “D” variables street design is most difficult to measure due to
complexity. It includes, for example, road and sidewalk width, safe crossing opportunities, street accompanying
trees, shelter at bus stops and first floor design.
e.g., GIS analysis,
on-
site assessment
by walk audits and
checklists,
interviews, surveys
Destination
accessibility
Distance or duration to key destinations of daily supply
The accessibility of destinations, or how close places are located to destinations people go to most regularly, is
most strongly associated with reduced VMT. This variable may be measured by the distance to a central
business district, the supply center or by how many jobs or attractions are within a three-minute drive or a
fifteen-minute walk
e.g., GIS analysis,
test walks
Distance to
transit
Distance from the starting point to the nearest public transport stop
Distance to transit, or public transit accessibility, is the key to attract more passengers. A dense network of
routes and stops will ensure that public transport users have no long distances to travel to or from stops.
e.g., GIS analysis,
testing, on-site ass-
essment

Minh-Chau Tran
Journal of Sustainable Urbanization, Planning and Progress (2016)–Volume 1, Issue 1 17
and lower SES. The level of walkability was de-
fined by using the neighborhood walkability index
score. This included the variables of net residential
density, intersection density and mixed land use de-
veloped within a geographic information system.
Physical activity was measured by using electronic
accelerometers that recorded motion every minute,
which is a valid and accepted method. Participants
completed a survey and wore the accelerometers for 4
to 7 days around the waist, except during sleep, swim-
ming and showering. Study dates ranged from 2002 to
2011 across countries.
Built environment variables were created with GIS
software. Buffers around each participant’s home
within 0.5 km and 1 km, reachable by the street net-
work, were defined to estimate accessible neighbor-
hood features. The comparable variables used were:
net residential density, street intersection density, retail
and civic land use ratio to buffer area, public transport
density, public park density and distance to nearest
transport.
Statistical analysis was carried out to link environ-
mental variables and physical activity (min/day) by
implementing generalized additive mixed models.
Four variables showed significant positive association
with higher physical activity levels: higher residential
density; higher number of intersection accessible to
pedestrians; higher density of public transport; and
more parks within walking distance (0.5 km) that were
free and open to all. Mixed use was surprisingly not
related to physical activity though this factor is one of
the more consistent correlates of physical activity.
This is explained by the lack of small scale data and
the limitations of GIS measures where the data were
based on a number of parcels of land, not on a number
of shops or offices which might be more strongly re-
lated to use frequency and thus higher activity level.
Further results showed that adults living in walka-
ble neighborhoods were 68–89 min/week more phys-
ically active than those in the least activity-friendly
neighborhoods. This shows that built environments
are able to assist residents to achieve 45%–59% of the
recommended 150 min/week
[23]
. This study showed
“clear evidence for the role of the built environment in
enhancing physical activity levels for entire popula-
tions, across socioeconomic classes and cultures, and
thereby preventing non-communicable disease.”
[47]
5. How to Build Places that Facilitate Active
Mobility in Everyday Life?
An important goal is to have these evidence-based res-
earch results embedded into planning and design prac-
tice. The objective of planning science in this field is,
inter alia, to identify those characteristics and urban
design configurations that prompt the decision to move
actively and that influence the perception of pede-
strians, and to operationalize them for the planning
and urban design practice. Besides raising awareness
for this topic, other necessary steps include identifica-
tion and assembling of stakeholders and alliance par-
tners, planning/projection, implementation and operation.
5.1 Methods to Obtain Addressee-focused Arguments
The challenge, among other things, is to convincingly
point out the link between, on the one hand certain
urban design and open space configurations, and on
the other hand the actual impact on health-promo-
ting behaviors and further social gains. In this policy,
the following requirement plays a crucial role: “To
what extent the growing social importance of health
can be reflected in urban planning itself, (...) ulti-
mately probably depends on whether the health aspect
receives political support from local decision-mak-
ing bodies.”
[48]
Urban planners and policy makers themselves have
pointed out that much practical evidence is required to
evaluate the effectiveness of existing planning poli-
cy
[43,49]
. Therefore, one of the next steps could be to
develop metrics to evaluate “success”, also economi-
cally, to address other parties such as investors, future
residents and public representatives who make finan-
cial decisions, “What is the value added by designing
for health? (…) – does it include enhanced productiv-
ity, longer lives, lower health care expenditures, more
robust tax bases?”
[17]
5.2 Awareness of Walkability Through Appropriate
Participation Formats
At the same time, the question was crucial, as to de-
termine whether the abstract results of these mea-
surements can be applied in the concrete building de-
sign practice and whether the needs of different popu-
lation groups can be considered. The difficult task
of building physical activity, such as walking, into
people’s daily lives, is therefore likely to require in-
novative participation and communication formats and
the appropriate tools in the future. Therefore, not only
the aspect of spatial and building design, but also the
common design of spatial processes with the local
people on site is crucial to create health-promoting
cities within the meaning of the Toronto Charter
Healthy cities — walkability as a component of health-promoting urban planning and design
18 Journal of Sustainable Urbanization, Planning and Progress (2016)–Volume 1, Issue 1
(2010)
[50]
: “Make the healthy choice the easy choice!”
Political education is a prerequisite when it comes to
mobilizing planning and policy on the one hand and
the people on the other for implementing health-pro-
moting construction measures. The first step is to raise
awareness among the participants and stakeholders for
this topic.
5.3 Walk Audits, Temporary Urban Interventions
and “Natural Experiments”
A powerful tool for raising awareness is systematic
on-site assessments (walk audits), guided by an audi-
tor, for example, an expert from the urban planning
field, so that elaborated suggestions for improvement
are adapted to the individual conditions of each area.
There are walk audit tools consisting of checklists,
questionnaire tools or computer-assisted audit tech-
niques. A new set of digital tools for collecting data of
the built environment and linking it with measured
people’s health outcomes as a reaction to certain urban
situations offers new possibilities; specially designed
apps on mobile phones and biosensors allowed for
recording participants’ movements and measuring
their excitement, interest, and levels of stress, locating
and visualizing them in a map such as in the experi-
ments conducted by Ellard and Montgomery in New
York, Berlin and Mumbai.
[51]
Urban temporary intervention in public space is
another instrument of procedural urban development
seen as part of planning and participation processes.
This could give impetus to possible long-term health-
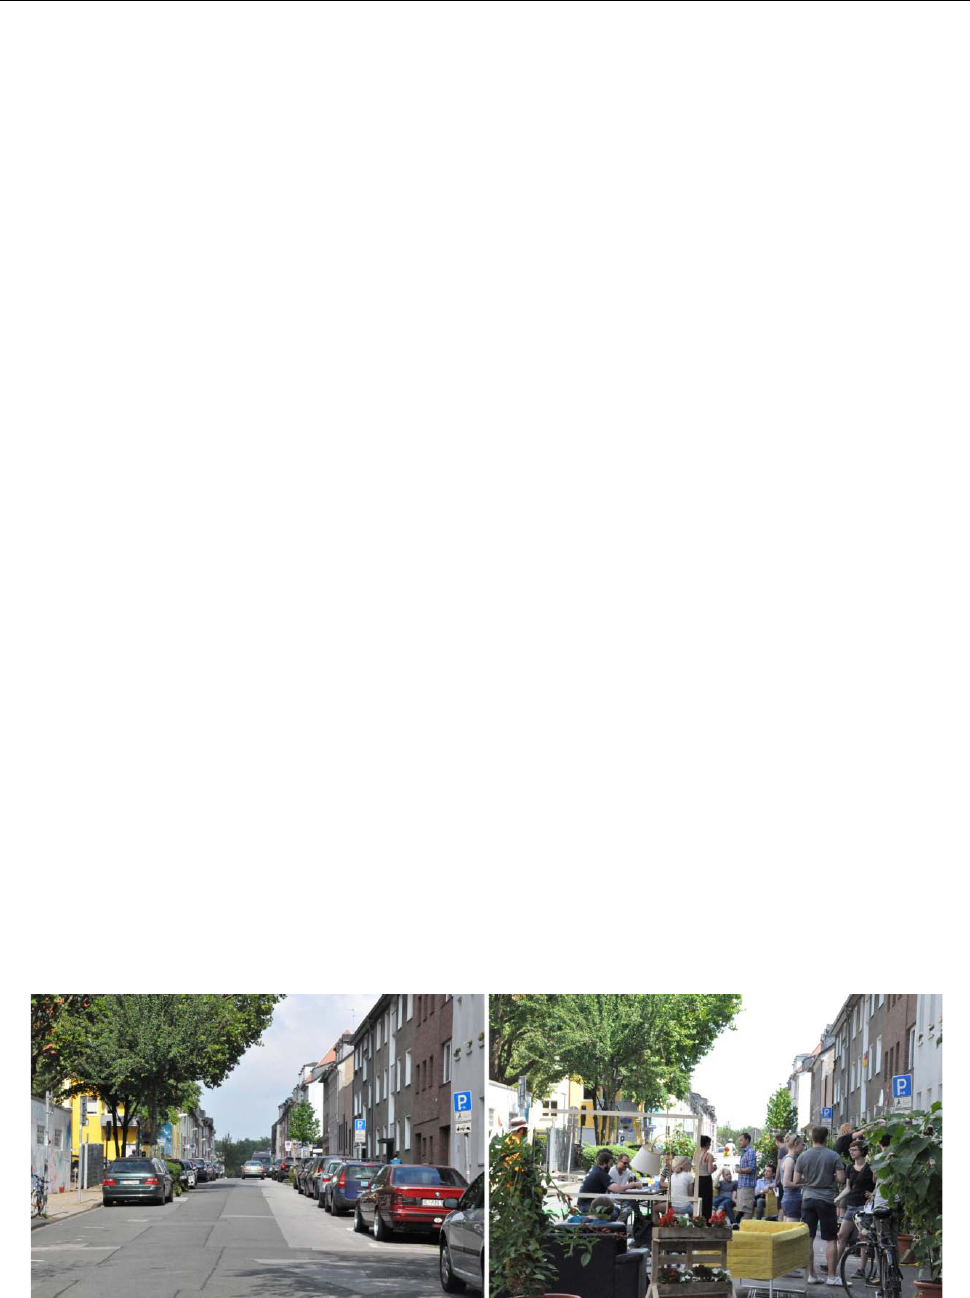
promoting behavioral change. Temporary street clo-
sures for automobiles, for example, can appear as a
test and preliminary step to future project opportuni-
ties, how streets can be designed to be more pede-
strian-friendly and thus inviting the people to reside
(Figure 5). With relatively few resources conditions
can be created for more security and social participa-
tion in public space. People can perceive, feel and live
their new space. Temporary conversions can activate
streets and present local retail and community facili-
ties. Through this process there will be a direct feed-
back from the users, and the effectiveness of the mea-
sures can be examined. In practice, these temporary
changes have often given impetus to a permanent
transformation: What had initially been regarded as an
experiment by the city was rebuilt into a permanent
solution following a positive evaluation. This method
could meet “long-standing calls for ‘natural experi-
ments’ in research.”
[17]
Windows of opportunities should be recognized and
utilized by these ideas as be linked to existing initia-
tives or urban redevelopment projects. Thus, this pro-
vides a specific opportunity for research to carry out
“natural experiments” to evaluate before and after
effects concerning health impacts, even if transport
policy or structural changes are not primarily aimed at
changing health behavior. These pre- and post-evalua-
tions provide valuable information, which typical
cross-sectional studies are unable to provide.
6. Conclusion
Apparently it is a worldwide phenomenon that plan-
ning and urban development are not committed
enough to health issues but still to the automobile and
to urban mobility, which is dealt in a highly sectoral
way and not considering social and health implica-
tions. In the end, for all sectors dealing with the plan-
ning and design of health-promoting cities and neigh-
borhoods it is a matter of pursuing the common goal
of reducing health threatening conditions, promoting
human health, and at the same time increasing the
Figure 5. Urban intervention “Urban Living Room” in Essen — before / after. (Source: Institute of City Planning and Urban Design)

Minh-Chau Tran
Journal of Sustainable Urbanization, Planning and Progress (2016)–Volume 1, Issue 1 19
quality of life for urban population. Cooperative res-
earch approaches based on findings in urban planning,
urban design, transport planning, health sciences and
socio-spatial research represent an important step in
the efforts of creating healthier and more livable cities
and neighborhoods.
But for those research findings to reach those in
practice, who plan, design and build our cities, neigh-
borhoods and street spaces, appropriate investment
and communication formats and other support as by
urban sociologists, educators and communication scie-
ntists are required. Strategic measures beyond mere
changes in the built environment may also call for
educational campaigns in public health, the exchange
of information about health promoting urban planning
as also the use of new media, changes in legal require-
ments, the encouragement of public dialogue and crea-
ting opportunities for participation and co-deliberation.
After 60 years of implementing the concept of a
car-friendly city, it is time to return to a health-pro-
moting and human oriented city. Facing energy short-
ages and social justice, it is important to apply a hu-
man scale in order to create healthy living and work-
ing conditions for all.
Conflict of Interest and Funding
No conflict of interest was reported.
References
1. World Health Organization (WHO), 2010, Hidden cities:
unmasking and overcoming health inequities in urban
settings, viewed July 13, 2014,
<http://www.who.int/kobe_centre/publications/hiddencit
ies_media/who_un_habitat_hidden_cities_web.pdf>
2. Corburn J, 2004, Confronting the challenges in recon-
necting urban planning and public health. American
Journal of Public Health, vol.94(4): 541–546.
3. Frumkin H, Frank L and Jackson R J, 2004, Design,
planning and building for healthy communities, in Ur-
ban Sprawl and Public Health, Island Press, Washington
D.C.
4. Tiwari G, 2015, Time for new mobility paradigm: chal-
lenges and opportunities facing pedestrian infrastructure
in cities. Presentation at the WALK21 Conference, viewed
October 22, 2015, Academic OneFile database.
5. South China Morning Post, 2015, Smog in northeast
China at nearly 50 times World Health Organisation
safe limits, viewed November 10, 2015,
<http://www.scmp.com/news/china/society/article/1877
282/smog-northeast-china-nearly-50-times-world-health
-organisation>
6. Omran A R, 1971, The epidemiologic transition. A
theory of the epidemiology of population change. Mil-
bank Memorial Fund Quarterly, vol.3(4): 731–757.
http://dx.doi.org/10.1111/j.1468-0009.2005.00398.x.
7. Holt-Lunstad J, Smith T B and Layton J B, 2010, Social
relationships and mortality risk: a meta-analytic review.
PLoS Medicine, vol.7(7): e1000316.
http://dx.doi.org/10.1371/journal.pmed.1000316.
8. Giles-Corti B, Macintyre S, Clarkson J P, et al. 2003.
Environmental and lifestyle factors associated with
overweight and obesity in Perth, Australia. American
Journal of Health Promotion, vol.18(1): 93–102.
9. Saelens B E, Sallis J F and Frank L D, 2003, Environ-
mental correlates of walking and cycling: findings from
the transportation, urban design, and planning literatures.
Annals of Behavioral Medicine, vol.25(2): 80–91.
http://dx.doi.org/10.1207/S15324796ABM2502_03.
10. Chelala C, 2015, Obesity outpaces growth in China, The
Japan Times, viewed October 24, 2015,
<http://www.japantimes.co.jp/opinion/2015/05/10/commen
tary/world-commentary/obesity-outpaces-growth-in-china/>.
11. Syme L, 2004, Social determinants of health: the com-
munity as an empowered partner, Centers for Disease
Control and Prevention, viewed June 25, 2014,
<http://www.cdc.gov/pcd/issues/2004/jan/03_0001.htm>
12. Corburn J, 2009, Towards the Healthy City: People, Place
and the Politics of Planning, MIT Press, Cambridge.
13. World Health Organization (WHO), 2010, Why urban
health matters, viewed July 13, 2014,
<http://www.who.int/world-health-day/2010/media/whd
2010background.pdf>
14. Barton H, 2005, A health map for urban planners — to-
wards a conceptual model for healthy, sustainable set-
tlements. Built Environment, vol.31(4): 339–355.
15. Dahlgren G and Whitehead M, 1991, Policies and
strategies to promote social equity in health: back-
ground document to WHO — strategy paper for Europe,
Institute for Future Studies, Stockholm, Sweden.
16. Designed to move, n.d., viewed September 30, 2015,
<http://www.designedtomove.org>
17. Bassett E M, 2014, Designing the Healthy Neigh-
borhood: Deriving Principles from the Evidence Base,
Hart Howerton, University of Virginia.
18. Wilkinson R and Marmot M, (eds.) 1998, The solid facts:
social determinants of health. WHO Regional Office for
Europe, Copenhagen.
19. Barton H and Tsourou C, 2000, Healthy Urban Pla-
nning, World Health Organisation, Europe, Spon Press,
Europe.
20. Dockery D W, Pope C A III, Xu X, et al. 1993, An asso-
ciation between air pollution and mortality in six U.S.

Healthy cities — walkability as a component of health-promoting urban planning and design
20 Journal of Sustainable Urbanization, Planning and Progress (2016)–Volume 1, Issue 1
cities. The New England Journal of Medicine, vol.329:
1753–1759.
http://dx.doi.org/10.1056/NEJM199312093292401.
21. Sallis J F, Cervero R B, Ascher W, et al. 2006, An eco-
logical approach to creating active living communities.
Annual Review Public Health, vol.27: 297–322.
http://dx.doi.org/10.1146/annurev.publhealth.27.021405.
102100.
22. MiD (Mobility in Germany), Institute for Applied Social
Sciences Ltd. and German Aerospace Center 2010, Mo-
bility in Germany 2008, Report Structure – Volum e –
Emissions – Trends. Bonn and Berlin, viewed June 3,
2015, German,
<http://www.mobilitaet-in-deutschland.de/pdf/MiD2008
_Abschlussbericht_I.pdf>
23. Robert Koch Institute, 2010, Health reporting in Ger-
many. Facts and figures: results of the study “Health in
Germany 2009”, Berlin, German.
24. Lee I M, Shiroma E J, Lobelo F, et al. 2012, Impact of
physical inactivity on the world’s major non-commu-
nicable diseases. The Lancet, vol.380(9838): 219–229.
http://doi.org/10.1016/S0140-6736(12)61031-9.
25. World Health Organization (WHO) 2009: 10, viewed
June 3, 2015,
<http://www.who.int/gho/publications/world_health_stat
istics/EN_WHS09_Full.pdf>
26. Gehl J, 2010, Cities for People, Island Press, Wash-
ington D.C.
27. Robertson-Wilson J and Giles-Corti B, (eds) 2010,
Walkability, neighbourhood design, and obesity, in Ob-
esogenic Environments: Complexities, Perceptions and
Objective Measures, Wiley-Blackwell, Oxford: 21–39.
http://dx.doi.org/10.1002/9781118786611.ch3.
28. Tran M C and Schmidt J A, 2014, Walkability from the
perspective of urban and transport planning, in J
Bucksch and S Schneider, Walkability — The Handbook
for Promotion of Physical Activity in the Community,
Hans Huber, Bern, 61–71, German.
29. Rogers S H, Halstead J M, Gardner K H, et al. 2010,
Examining walkability and social capital as indicators of
quality of life at the municipal and neighborhood scales.
Journal of Applied Research in Quality of Life, vol.6(2):
201–213. http://dx.doi.org/10.1007/s11482-010-9132-4.
30. Walljasper J, 2013, Walking as a way of life movement
for health & happiness, viewed April 22, 2016,
<http://everybodywalk.org/media_assets/WalkingAsAW
ayOfLife1_Final.pdf>
31. Cervero R and Kockelman K, 1997, Travel demand and
the 3ds: density, diversity, and design, Transportation
Research Part D: Transport and Environment, vol.2(3):
199–219.
http://dx.doi.org/10.1016/S1361-9209(97)00009-6.
32. Vogler P and Kühn E, (eds.) 1957, Medicine and urban
design, A Handbook for Healthy Urban Design, Volume
1 and 2, Urban & Schwarzenberg, Munich, Berlin,
Vienna, German.
33. ILS Institute of Regional and Urban Development Re-
search of North Rhine-Westphalia, (eds.) 1979, in Space
for Pedestrians, Dortmund: 1–3, German.
34. ILS Institute for Regional and Urban Development Re-
search of North Rhine-Westphalia, (eds.) 2001, in Pede-
strian Traffic — A Planning Guide for Practice, Series
Bausteine 24, Dortmund, German.
35. Rodenstein M, (eds) 1996, City and hygiene since the
18th century, in Does City Make us Sick? Dealing with
Health and Disease, Dölling and Galitz, Hamburg, German.
36. Lee C and Moudon A V, 2006, Correlates of walking for
transportation or recreation purposes. Journal of Physi-
cal Activity and Health, vol.3(sup.1): 77–98.
37. Brownson R C, Hoehner C M, Day K et al. 2009, Mea-
suring the built environment for physical activity: state
of the science. American Journal of Preventive Med-
icine, vol.36(4): S99–S123.e12.
http://dx.doi.org/10.1016/j.amepre.2009.01.005.
38. Sauter D, Hogertz C, Tight M, et al. 2010, Introduction,
COST 358 Pedestrians´ Quality Needs: measuring walk-
ing, PQN final report — Part B4: documentation, Euro-
pean Science Foundation, viewed September 11, 2010,
<http://www.walkeurope.org/uploads/File/publications/
PQN%20Final%20Report%20part%20B4.pdf>
39. Ewing R and Cervero R, 2010, Travel and the built en-
vironment. Journal of the American Planning Associa-
tion, vol.76(3): 265–294.
http://dx.doi.org/10.1080/01944361003766766.
40. Appleyard D, 1981, Livable Streets, University of Cali-
fornia Press, Berkeley.
41. Whyte W, 1980, The Social Life Of Small Urban Spaces,
Project for Public Spaces Inc.
42. Jacobs J, 1961, The Death and Life of Great American
Cities, Vintage Books, New York.
43. Allender S, Cavill N, Parker M et al. 2009, ‘Tell us
something we don’t already know or do!’ — the res-
ponse of planning and transport professionals to public
health guidance on the built environment and physical
activity. Journal of Public Health Policy, vol.30(1):
102–116.
http://dx.doi.org/10.1057/jphp.2008.43.
44. Tran M C, 2014, Walkability — assessment of structural
and urban design features on macro and micro level, in
Koch M K, Krüger V, Schmidt A (eds), Competition
Energy Efficient City — Urban Development and Mo-
bility. Energy and Sustainability 4, Lit Publisher, Ber-
lin-Münster-Vienna-Zurich-London, German.
45. Campoli J, 2012, Made for Walking — Density and

Minh-Chau Tran
Journal of Sustainable Urbanization, Planning and Progress (2016)–Volume 1, Issue 1 21
Neighborhood Form, Lincoln Institute of Land Policy,
Cambridge, Massachusetts.
46. Sallis J F, Cerin E, Conway T L, et al. 2016, Physical
activity in relation to urban environments in 14 cities
worldwide: a cross-sectional study. The Lancet,
vol.387(10034): 2207–2217.
http://dx.doi.org/10.1016/S0140-6736(15)01284-2
47. Goenka S and Andersen L B, 2016, Our health is a func-
tion of where we live, The Lancet, vol.387(10034):
2168–2170.
http://dx.doi.org/10.1016/S0140-6736(16)00348-2
48. Rodenstein M, (eds.), 1994, Will the life in our cities be
healthier? in Health in the City. Models-experiences-
perspectives, Fischer paperback publisher, Frankfurt/
Mainz: 39–55, German.
49. Koohsari M J, Badland H and Giles-Corti B, 2013, (Re)
Designing the built environment to support physical ac-
tivity: bringing public health back into urban design and
planning. Cities, vol.35: 294–298.
http://dx.doi.org/10.1016/j.cities.2013.07.001.
50. Global Advocacy Council for Physical Activity, Interna-
tional Society for Physical Activity and Health, 2010,
The Toronto Charter for Physical Activity: a global call
for action. Journal of Physical Activity and Health,
vol.7(s3): S370–S373.
http://dx.doi.org/10.1123/jpah.7.s3.s370.
51. Ellard C and Montgomery C, 2013, Testing, Testing!: a
psychological study on city spaces and how they affect
our bodies and minds, BMW Guggenheim Lab, viewed
April 15, 2015,
<http://thehappycity.com/wpcontent/uploads/2015/04/TESTI
NG_TESTING_BMW_GUGGENHEIM_LAB_2013.pdf>
